signal strength 3 of 5

According to the chart of M30, EURGBP formed the Bullish Rectangle. This type of a pattern indicates a trend continuation. It consists of two levels: resistance 0.8615 and support 0.8598. In case the resistance level 0.8615 - 0.8615 is broken, the instrument is likely to follow the bullish trend.
انظر أيضا
- All
- Double Top
- Flag
- Head and Shoulders
- Pennant
- Rectangle
- Triangle
- Triple top
- All
- #AAPL
- #AMZN
- #Bitcoin
- #EBAY
- #FB
- #GOOG
- #INTC
- #KO
- #MA
- #MCD
- #MSFT
- #NTDOY
- #PEP
- #TSLA
- #TWTR
- AUDCAD
- AUDCHF
- AUDJPY
- AUDUSD
- EURCAD
- EURCHF
- EURGBP
- EURJPY
- EURNZD
- EURRUB
- EURUSD
- GBPAUD
- GBPCHF
- GBPJPY
- GBPUSD
- GOLD
- NZDCAD
- NZDCHF
- NZDJPY
- NZDUSD
- SILVER
- USDCAD
- USDCHF
- USDJPY
- USDRUB
- All
- M5
- M15
- M30
- H1
- D1
- All
- Buy
- Sale
- All
- 1
- 2
- 3
- 4
- 5
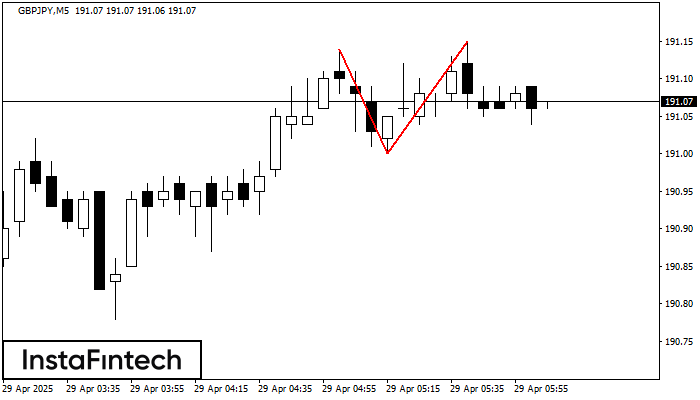
The Double Top pattern has been formed on GBPJPY M5. It signals that the trend has been changed from upwards to downwards. Probably, if the base of the pattern 191.00
The M5 and M15 time frames may have more false entry points.
Open chart in a new window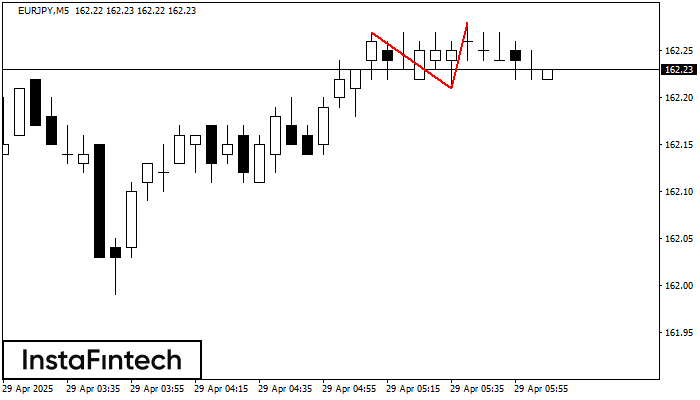
The Double Top reversal pattern has been formed on EURJPY M5. Characteristics: the upper boundary 162.27; the lower boundary 162.21; the width of the pattern is 7 points. Sell trades
The M5 and M15 time frames may have more false entry points.
Open chart in a new window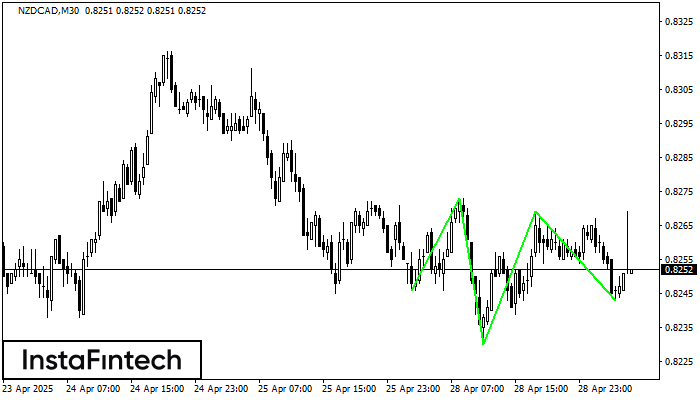
According to the chart of M30, NZDCAD formed the Inverse Head and Shoulder pattern. The Head’s top is set at 0.8269 while the median line of the Neck is found
Open chart in a new window