signal strength 2 of 5
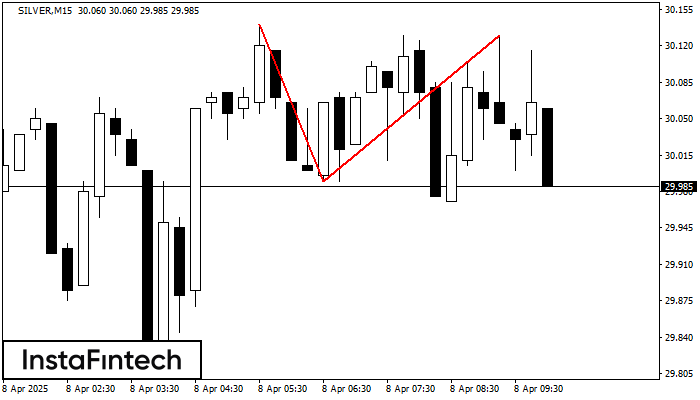
The Double Top reversal pattern has been formed on SILVER M15. Characteristics: the upper boundary 30.14; the lower boundary 29.99; the width of the pattern is 140 points. Sell trades are better to be opened below the lower boundary 29.99 with a possible movements towards the 29.97 level.
The M5 and M15 time frames may have more false entry points.
See Also
- All
- Double Top
- Flag
- Head and Shoulders
- Pennant
- Rectangle
- Triangle
- Triple top
- All
- #AAPL
- #AMZN
- #Bitcoin
- #EBAY
- #FB
- #GOOG
- #INTC
- #KO
- #MA
- #MCD
- #MSFT
- #NTDOY
- #PEP
- #TSLA
- #TWTR
- AUDCAD
- AUDCHF
- AUDJPY
- AUDUSD
- EURCAD
- EURCHF
- EURGBP
- EURJPY
- EURNZD
- EURRUB
- EURUSD
- GBPAUD
- GBPCHF
- GBPJPY
- GBPUSD
- GOLD
- NZDCAD
- NZDCHF
- NZDJPY
- NZDUSD
- SILVER
- USDCAD
- USDCHF
- USDJPY
- USDRUB
- All
- M5
- M15
- M30
- H1
- D1
- All
- Buy
- Sale
- All
- 1
- 2
- 3
- 4
- 5
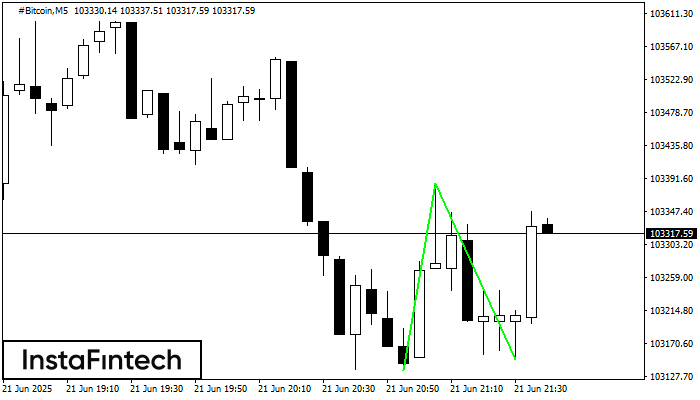
The Double Bottom pattern has been formed on #Bitcoin M5; the upper boundary is 103384.03; the lower boundary is 103150.22. The width of the pattern is 24856 points. In case
The M5 and M15 time frames may have more false entry points.
Open chart in a new window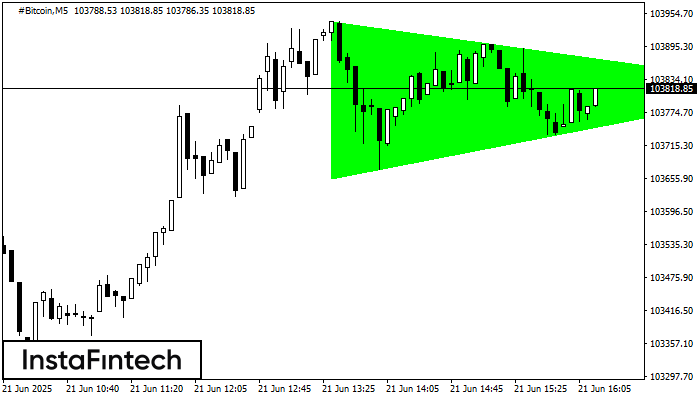
According to the chart of M5, #Bitcoin formed the Bullish Symmetrical Triangle pattern. The lower border of the pattern touches the coordinates 103655.19/103820.77 whereas the upper border goes across 103940.04/103820.77
The M5 and M15 time frames may have more false entry points.
Open chart in a new window
The Triple Bottom pattern has been formed on GOLD M5. It has the following characteristics: resistance level 3372.86/3370.25; support level 3364.73/3364.26; the width is 813 points. In the event
The M5 and M15 time frames may have more false entry points.
Open chart in a new window