

Actual patterns
Patterns are graphical models which are formed in the chart by the price. According to one of the technical analysis postulates, history (price movement) repeats itself. It means that the price movements are often similar in the same situations which makes it possible to predict the further development of the situation with a high probability.
Actual Patterns
- All
- Double Top
- Flag
- Head and Shoulders
- Pennant
- Rectangle
- Triangle
- Triple top
- All
- #AAPL
- #AMZN
- #Bitcoin
- #EBAY
- #FB
- #GOOG
- #INTC
- #KO
- #MA
- #MCD
- #MSFT
- #NTDOY
- #PEP
- #TSLA
- #TWTR
- AUDCAD
- AUDCHF
- AUDJPY
- AUDUSD
- EURCAD
- EURCHF
- EURGBP
- EURJPY
- EURNZD
- EURRUB
- EURUSD
- GBPAUD
- GBPCHF
- GBPJPY
- GBPUSD
- GOLD
- NZDCAD
- NZDCHF
- NZDJPY
- NZDUSD
- SILVER
- USDCAD
- USDCHF
- USDJPY
- USDRUB
- All
- M5
- M15
- M30
- H1
- D1
- All
- Buy
- Sale
- All
- 1
- 2
- 3
- 4
- 5

Сформирована фигура «Прямоугольник» на графике #Bitcoin M5. Тип фигуры: Продолжение тренда; Границы: Верхняя 94251.10, Нижняя 94078.08; Сигнал: позиция на продажу открывается после фиксации цены ниже границы прямоугольника 94078.08
Таймфреймы М5 и М15 могут иметь больше ложных точек входа.
Открыть график инструмента в новом окне
По #Bitcoin на M5 сформировалась фигура «Тройное дно». Характеристика: Нижняя граница фигуры имеет координаты 94078.08, при этом верхняя граница 94416.04/94251.10. Проекция ширины 31582 пунктов. Формирование фигуры «Тройное дно» наиболее вероятным
Таймфреймы М5 и М15 могут иметь больше ложных точек входа.
Открыть график инструмента в новом окне
На графике #Bitcoin M5 образовалась фигура «Тройная вершина». Данная фигура относится к типу разворотных и имеет характеристику: Верхняя граница 94313.33/94332.71; Нижняя граница 94181.05/94204.35; Ширина фигуры 12797 пунктов. Прогноз: В случае
Таймфреймы М5 и М15 могут иметь больше ложных точек входа.
Открыть график инструмента в новом окне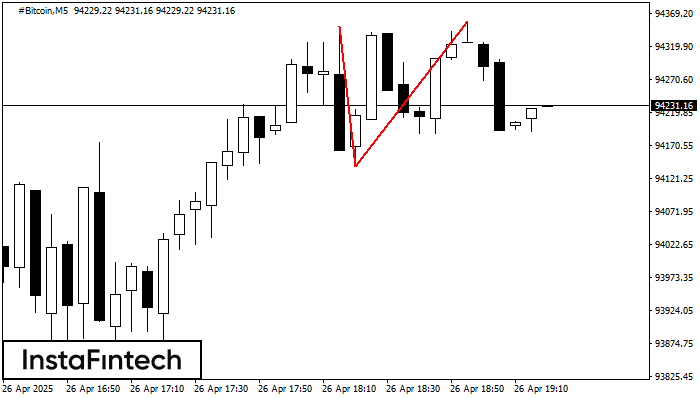
По #Bitcoin на M5 сформировалась разворотная фигура «Двойная вершина». Характеристика: Верхняя граница 94348.84; Нижняя граница 94140.31; Ширина фигуры 21661 пунктов. Позицию на продажу возможно открыть ниже нижней границы 94140.31
Таймфреймы М5 и М15 могут иметь больше ложных точек входа.
Открыть график инструмента в новом окне
Сформирована фигура «Тройное дно» по торговому инструменту #Bitcoin на M15. Фигура сигнализирует об изменении тенденции с нисходящей на восходящую в случае пробоя верхней границы 95153.13
Таймфреймы М5 и М15 могут иметь больше ложных точек входа.
Открыть график инструмента в новом окне
По торговому инструменту AUDUSD на M5 сформировалась фигура «Двойная вершина», которая сигнализирует нам об изменении тенденции с восходящей на нисходящую. Вероятно, что, в случае пробоя основания фигуры 0.6399, возможно дальнейшее
Таймфреймы М5 и М15 могут иметь больше ложных точек входа.
Открыть график инструмента в новом окне
На торговом графике GBPUSD M15 сформировалась разворотная фигура «Двойная вершина». Характеристика: Верхняя граница 1.3332; Нижняя граница 1.3315; Ширина фигуры 17 пунктов. Сигнал: Пробой нижней границы 1.3315 приведет к дальнейшему нисходящему
Таймфреймы М5 и М15 могут иметь больше ложных точек входа.
Открыть график инструмента в новом окне
На торговом графике EURNZD H1 сформировалась разворотная фигура «Двойная вершина». Характеристика: Верхняя граница 1.9079; Нижняя граница 1.9023; Ширина фигуры 56 пунктов. Сигнал: Пробой нижней границы 1.9023 приведет к дальнейшему нисходящему
Открыть график инструмента в новом окне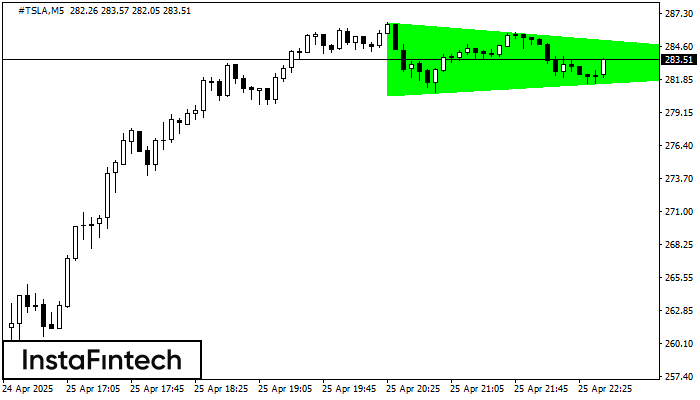
По #TSLA на M5 фигура «Бычий симметричный треугольник». Характеристика: Фигура продолжения тренда; Координаты границ – верхняя 286.59, нижняя 280.59. Проекция ширины фигуры 600 пунктов. Прогноз: В случае пробоя верхней границы
Таймфреймы М5 и М15 могут иметь больше ложных точек входа.
Открыть график инструмента в новом окне


