


signal strength 1 of 5
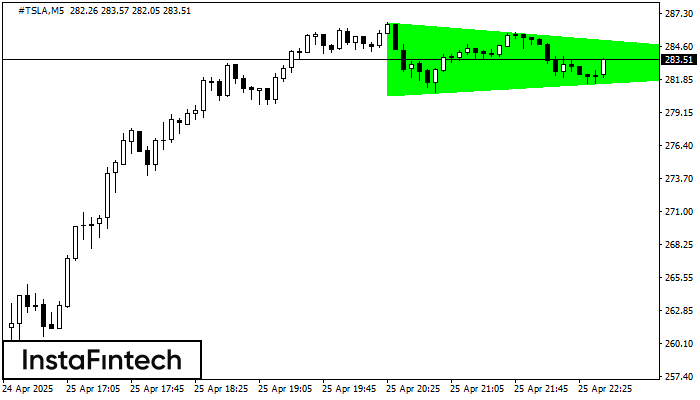
According to the chart of M5, #TSLA formed the Bullish Symmetrical Triangle pattern. Description: This is the pattern of a trend continuation. 286.59 and 280.59 are the coordinates of the upper and lower borders respectively. The pattern width is measured on the chart at 600 pips. Outlook: If the upper border 286.59 is broken, the price is likely to continue its move by 283.19.
The M5 and M15 time frames may have more false entry points.
Lihat juga
- All
- Double Top
- Flag
- Head and Shoulders
- Pennant
- Rectangle
- Triangle
- Triple top
- All
- #AAPL
- #AMZN
- #Bitcoin
- #EBAY
- #FB
- #GOOG
- #INTC
- #KO
- #MA
- #MCD
- #MSFT
- #NTDOY
- #PEP
- #TSLA
- #TWTR
- AUDCAD
- AUDCHF
- AUDJPY
- AUDUSD
- EURCAD
- EURCHF
- EURGBP
- EURJPY
- EURNZD
- EURRUB
- EURUSD
- GBPAUD
- GBPCHF
- GBPJPY
- GBPUSD
- GOLD
- NZDCAD
- NZDCHF
- NZDJPY
- NZDUSD
- SILVER
- USDCAD
- USDCHF
- USDJPY
- USDRUB
- All
- M5
- M15
- M30
- H1
- D1
- All
- Buy
- Sale
- All
- 1
- 2
- 3
- 4
- 5
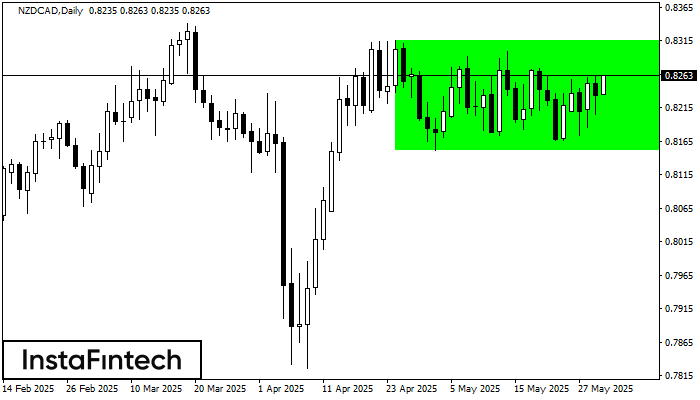
Menurut grafik dari D1, NZDCAD terbentuk Persegi Bullish. Pola menunjukkan kelanjutan tren. Batas atas adalah 0.8316, batas lebih rendah adalah 0.8151. Sinyal berarti posisi beli harus dibuka diatas batas atas
Open chart in a new window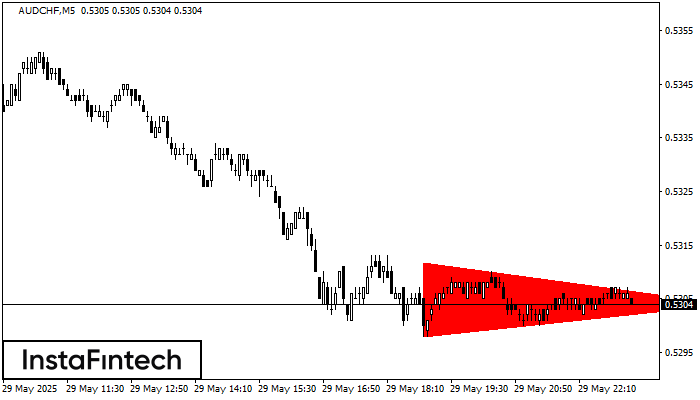
Menurut Grafik dari M5, AUDCHF dibentuk pola Segitiga Simetris Bearish. Rekomendasi Trading: Penembusan dari batas yang lebih rendah 0.5298 kemungkinan akan mendorong kelanjutan dari tren penurunan
Rangka waktu M5 dan M15 mungkin memiliki lebih dari titik entri yang keliru.
Open chart in a new window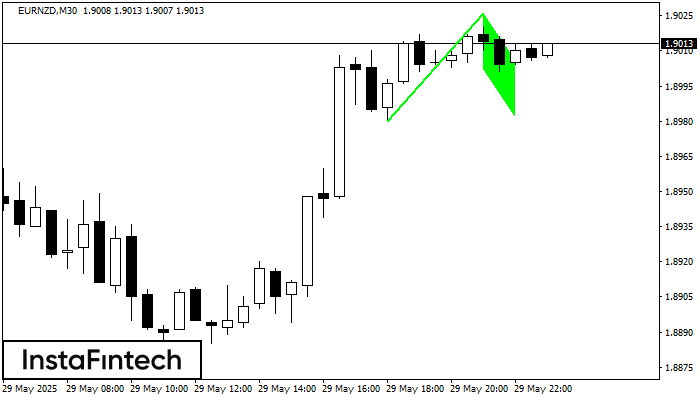
Pola Bendera Bullish yang memberikan sinyal kelanjutan tren telah terbentuk di grafik EURNZD M30. Prakiraan: jika harga menembus ke atas titik tertinggi harga di 1.9026, maka para trader akan dapat
Open chart in a new window


