signal strength 3 of 5

According to the chart of M30, EURGBP formed the Bullish Rectangle. This type of a pattern indicates a trend continuation. It consists of two levels: resistance 0.8615 and support 0.8598. In case the resistance level 0.8615 - 0.8615 is broken, the instrument is likely to follow the bullish trend.
- All
- Double Top
- Flag
- Head and Shoulders
- Pennant
- Rectangle
- Triangle
- Triple top
- All
- #AAPL
- #AMZN
- #Bitcoin
- #EBAY
- #FB
- #GOOG
- #INTC
- #KO
- #MA
- #MCD
- #MSFT
- #NTDOY
- #PEP
- #TSLA
- #TWTR
- AUDCAD
- AUDCHF
- AUDJPY
- AUDUSD
- EURCAD
- EURCHF
- EURGBP
- EURJPY
- EURNZD
- EURRUB
- EURUSD
- GBPAUD
- GBPCHF
- GBPJPY
- GBPUSD
- GOLD
- NZDCAD
- NZDCHF
- NZDJPY
- NZDUSD
- SILVER
- USDCAD
- USDCHF
- USDJPY
- USDRUB
- All
- M5
- M15
- M30
- H1
- D1
- All
- Buy
- Sale
- All
- 1
- 2
- 3
- 4
- 5
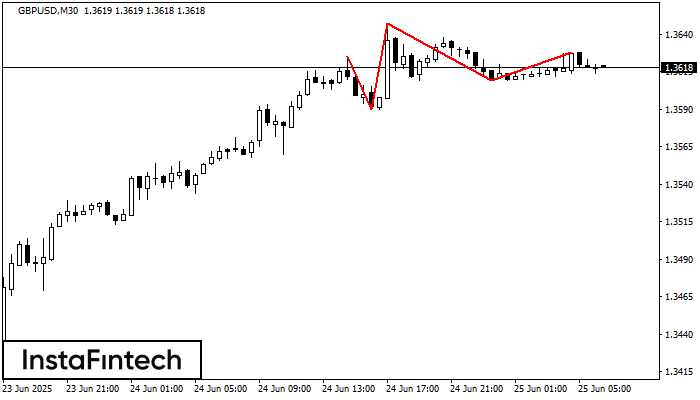
According to the chart of M30, GBPUSD formed the Head and Shoulders pattern. The Head’s top is set at 1.3647 while the median line of the Neck is found
Open chart in a new window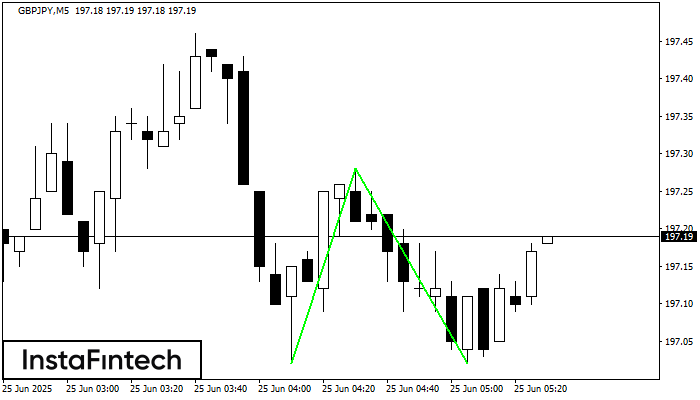
The Double Bottom pattern has been formed on GBPJPY M5. Characteristics: the support level 197.02; the resistance level 197.28; the width of the pattern 26 points. If the resistance level
The M5 and M15 time frames may have more false entry points.
Open chart in a new window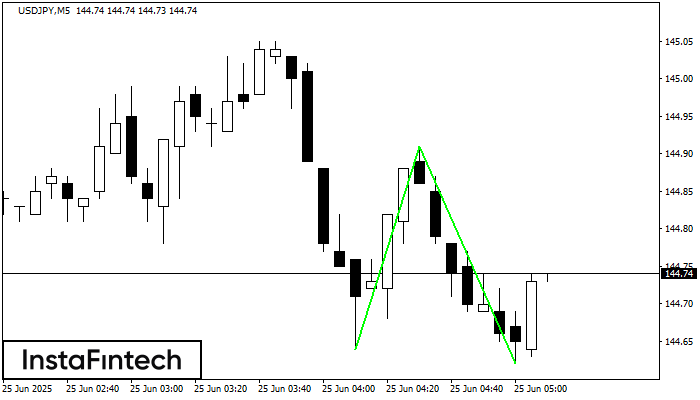
The Double Bottom pattern has been formed on USDJPY M5. Characteristics: the support level 144.64; the resistance level 144.91; the width of the pattern 27 points. If the resistance level
The M5 and M15 time frames may have more false entry points.
Open chart in a new window