Актуальные паттерны
Паттерны – это графические модели, которые "рисует" цена на графике. Один из постулатов технического анализа говорит нам о том, что история (движение цены) всегда повторяется. Это значит, что в похожих ситуациях движение цены, зачастую, будет похожим, что позволяет с высокой долей вероятности спрогнозировать дальнейшее развитие ситуации.
Актуальные паттерны
- Все
- Вымпел
- Голова и плечи
- Двойная вершина
- Прямоугольник
- Треугольник
- Тройная вершина
- Флаг
- Все
- #AAPL
- #AMZN
- #Bitcoin
- #EBAY
- #FB
- #GOOG
- #INTC
- #KO
- #MA
- #MCD
- #MSFT
- #NTDOY
- #PEP
- #TSLA
- #TWTR
- AUDCAD
- AUDCHF
- AUDJPY
- AUDUSD
- EURCAD
- EURCHF
- EURGBP
- EURJPY
- EURNZD
- EURRUB
- EURUSD
- GBPAUD
- GBPCHF
- GBPJPY
- GBPUSD
- GOLD
- NZDCAD
- NZDCHF
- NZDJPY
- NZDUSD
- SILVER
- USDCAD
- USDCHF
- USDJPY
- USDRUB
- Все
- M5
- M15
- M30
- H1
- D1
- Все
- Покупка
- Продажа
- Все
- 1
- 2
- 3
- 4
- 5
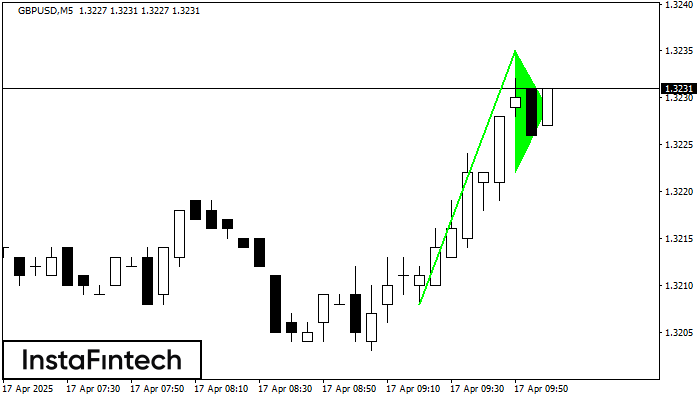
Графическая фигура «Бычий вымпел» сформировалась по инструменту GBPUSD на M5. Данный вид фигуры относится к типу продолжения тенденции. В случае если котировке удастся преодолеть максимум вымпела 1.3235, то ожидается продолжение
Таймфреймы М5 и М15 могут иметь больше ложных точек входа.
Открыть график инструмента в новом окне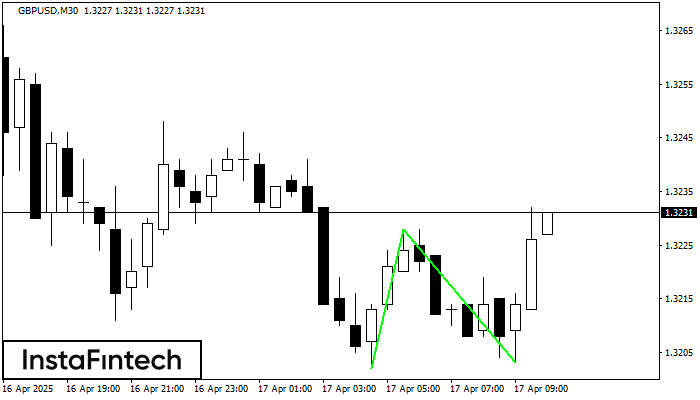
Сформирована фигура «Двойное дно» на графике GBPUSD M30. Верхняя граница 1.3228; Нижняя граница 1.3203; Ширина фигуры 26 пунктов. В случае пробоя верхней границы 1.3228 можно будет прогнозировать изменение тенденции
Открыть график инструмента в новом окне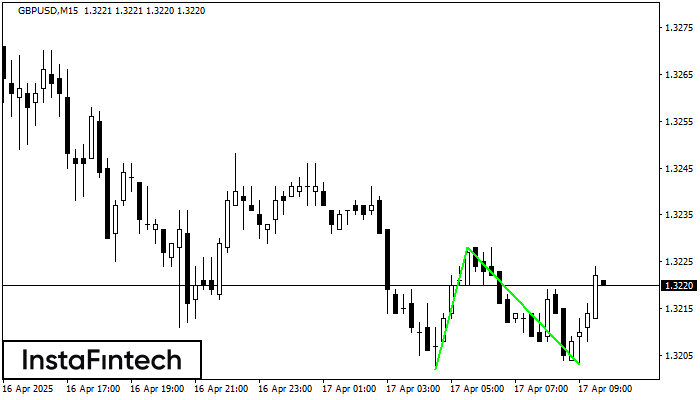
Сформирована фигура «Двойное дно» на графике GBPUSD M15. Данное формирование сигнализирует об изменении тенденции с нисходящего на восходящее движение. Сигнал: Торговую позицию на покупку следует открывать после пробоя верхней границы
Таймфреймы М5 и М15 могут иметь больше ложных точек входа.
Открыть график инструмента в новом окне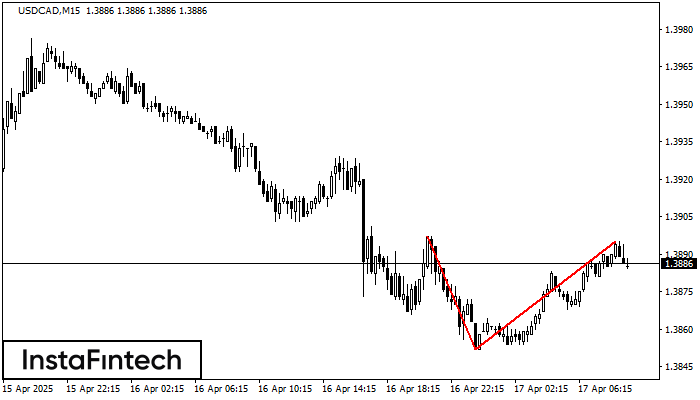
На торговом графике USDCAD M15 сформировалась разворотная фигура «Двойная вершина». Характеристика: Верхняя граница 1.3895; Нижняя граница 1.3852; Ширина фигуры 43 пунктов. Сигнал: Пробой нижней границы 1.3852 приведет к дальнейшему нисходящему
Таймфреймы М5 и М15 могут иметь больше ложных точек входа.
Открыть график инструмента в новом окне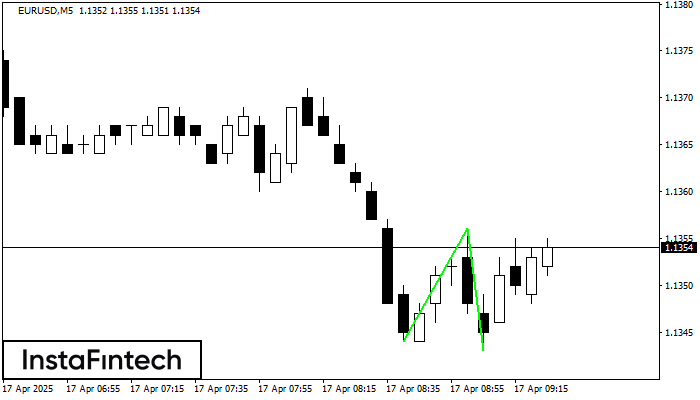
Сформирована фигура «Двойное дно» на графике EURUSD M5. Характеристика: Уровень поддержки 1.1344; Уровень сопротивления 1.1356; Ширина фигуры 12 пунктов. В случае пробоя уровня сопротивления можно будет прогнозировать изменение тенденции
Таймфреймы М5 и М15 могут иметь больше ложных точек входа.
Открыть график инструмента в новом окне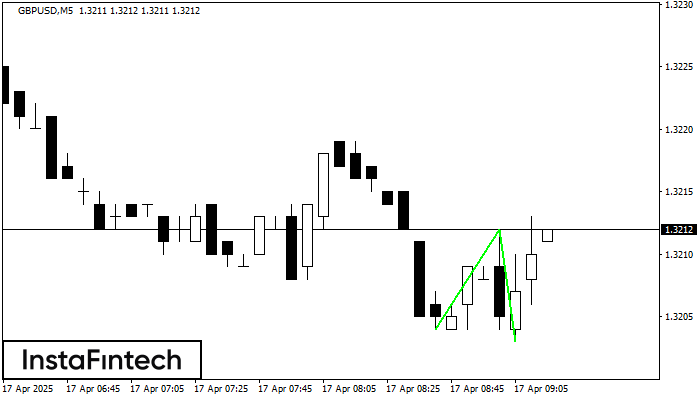
Сформирована фигура «Двойное дно» на графике GBPUSD M5. Верхняя граница 1.3212; Нижняя граница 1.3203; Ширина фигуры 8 пунктов. В случае пробоя верхней границы 1.3212 можно будет прогнозировать изменение тенденции
Таймфреймы М5 и М15 могут иметь больше ложных точек входа.
Открыть график инструмента в новом окне
На торговом графике EURJPY M30 сформировалась разворотная фигура «Двойная вершина». Характеристика: Верхняя граница 162.23; Нижняя граница 161.48; Ширина фигуры 75 пунктов. Сигнал: Пробой нижней границы 161.48 приведет к дальнейшему нисходящему
Открыть график инструмента в новом окне
Сформирована фигура «Двойное дно» на графике AUDUSD M5. Характеристика: Уровень поддержки 0.6353; Уровень сопротивления 0.6366; Ширина фигуры 13 пунктов. В случае пробоя уровня сопротивления можно будет прогнозировать изменение тенденции
Таймфреймы М5 и М15 могут иметь больше ложных точек входа.
Открыть график инструмента в новом окне
По торговому инструменту AUDUSD на M5 сформировалась фигура продолжения тренда - «Прямоугольник». Фигура имеет границы: Нижняя 0.6353; Верхняя 0.6366. В случае пробоя нижней границы вероятно дальнейшее движение в сторону тренда
Таймфреймы М5 и М15 могут иметь больше ложных точек входа.
Открыть график инструмента в новом окне