empty
20.10.2020 02:03 AM
Commodity currency pairs AUD/USD & USD/CAD & NZD/USD on 4-hour charts. Comprehensive analysis of APLs & ZUP traffic options from 20/10/2020

The Minute operating scale (H4)

Is the US Dollar continuing to dominate commodity currencies? Overview of AUD/USD & USD/CAD & NZD/USD H4 possibilities from October 20, 2020

____________________

Australian Dollar vs US Dollar

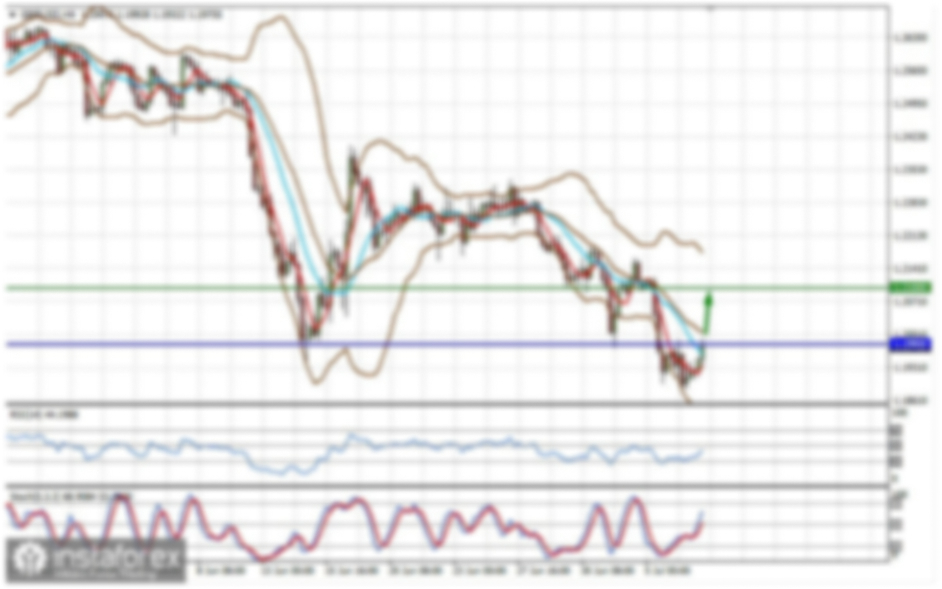
The development of the movement of the Australian Dollar in the AUD/USD pair from October 20, 2020 will be determined by the development and direction of the breakdown of the range:

  • The resistance level of 0.7110 at the lower border of the channel 1/2 Median Line of the Minuette operating scale pitchfork
  • The support level of 0.7085 on the initial SSL line of the Minuette operational scale pitchfork

In case of a breakdown of the support level [B] 0.7085 / B] on the initial SSL line of the Minuette operational scale pitchfork, the downward movement of AUD / USD can be directed towards these targets:

  • LTL control line for Minute operational scale pitchforks (0.7057)
  • The control line at LTL Minuette operational scale pitchforks 0.7045
  • Warning line at LWL38.2 (0.7017) of the Minute operational scale pitchfork
  • The local minimum of 0.7007
  • Warning line at LWL 61.8 Minute (0.6955)

A breakout of the 0.7110 resistance level will make it important to develop the movement of the Australian Dollar inside the 1/2 Median Line Minuette channel (0.7110 - 0.7127 - 0.7145) with the possibility of reaching the equilibrium zone (0.7175 - 0.7205 - 0.7235) of the Minuette operational scale pitchforks and channel boundaries 1/2 Median Line (0.7235 - 0.7290 - 0.7350) which is a fork of the Minute operational scale.

This image is no longer relevant

____________________

US Dollar vs Canadian Dollar

The movement of the Canadian Dollar in the USD/CAD pair from October 20, 2020 will also depend on the development and direction of the breakdown of the range:

  • The resistance level of 1.3185 on the RL38.2 reaction line of the Minuette operational scale pitchfork
  • The support level of 1.3100 on the initial SSL line of the Minuette operational scale pitchfork

Breakdown of the reaction line RL38.2 Minuette: there will be a resistance level of 1.3185 and the resumption of the development of the USD / CAD upward movement to the boundaries of the 1/2 Median Line channel (1.3210 - 1.3245 - 1.3280) and to the equilibrium zone (1.3300 - 1.3350 - 1.3400) of the Minuette operating scale pitchfork.

In case of a breakdown of the support level 1.3140 on the initial SSL line of the Minuette operational scale, the development of the Canadian Dollar's movement may continue to the boundaries of the 1/2 Median Line channel (1.3090 - 1.3030 - 1.2980) of the Minute operational scale pitchfork.

This image is no longer relevant

____________________

New Zealand Dollar vs US Dollar

The New Zealand Dollar in the NZD/USD pair from October 20, 2020, as in the first two cases, will continue to move depending on the development and direction of the breakdown of the range:

  • The resistance level of 0.6660 on the UTL control line of the Minuette operational scale pitchfork
  • The support level of 0.6625 on the initial SSL line of the Minuette operational scale pitchfork

If the initial SSL line of the Minuette operational scale pitchfork is broken down to the support of level 0.6625, the development of the NZD/USD pair's movement may continue to the targets:

  • Initial SSL line (0.6607) of the Minute operational scale pitchfork
  • Local minimum of 0.6573

with the prospect of reaching the borders of the 1/2 Median Line channel (0.6555 - 0.6525 - 0.6495) which is a fork of the Minuette operational scale.

A breakout of the resistance level 0.6660 on the UTL control line for the Minuette operational scale is an option to continue the development of the upward movement of the New Zealand Dollar towards these goals:

  • Local maximum of 0.6679
  • The lower limit ISL38.2 (0.6727) of the equilibrium zone of the pitchfork of the Minute operational scale
  • The median Line (0.6767) of the Minute operational scale pitchfork

This image is no longer relevant

____________________

The review is compiled without taking into account the news background and the opening of trading sessions of the main financial centers and is not a guide to action (placing buy or sell orders).

Ratu Taslim,
ผู้เชี่ยวชาญด้านการวิเคราะห์ของ InstaForex
© 2007-2025
เลือกช่วงเวลา
5
นาที
15
นาที
30
นาที
1
ชั่วโมง
4
ชั่วโมง
1
วัน
1
สัปดาห์
รับผลกำไรจากการเปลี่ยนแปลงอัตราสกุลเงินดิจิทัลกับ InstaForex.
ดาวน์โหลด MetaTrader 4 และเปิดการซื้อขายครั้งแรกของคุณ.
การโจมตีของอิหร่านทำให้วิกฤติน้ำมันรุนแรงขึ้น: ดัชนี S&P 500 หยุดชะงักก่อนข้อมูลสำคัญของสหรัฐ การโจมตีของสหรัฐฯต่ออิหร่านทำให้เกิดความกังวลเกี่ยวกับน้ำมัน และการตอบโต้ ดัชนี S&P 500 อยู่ใกล้ระดับสูงแห่งเดือนกุมภาพันธ์ แต่แสดงสัญญาณของความทรงตัว ราคาน้ำมันที่เพิ่มขึ้นมาเกิดความกังวลเกี่ยวกับอัตราเงินเฟ้อ, นโยบายของ Fed นักลงทุนเริ่มเหล่างทอดสายตาไปยังข้อมูลเศรษฐกิจของสหรัฐฯที่จะมาถึงเพื่อค้นหาทิศทรงตลาด Spectris เพิ่มขึ้นหลังจากได้รับการอนุมัติสำหรับการรับซื้อที่ใหญ่ที่สุดในประเทศสหราชอาณาจักรในปีนี้ Holcim เพิ่มขึ้นหลังจากการแยกส่วนของ
ข่าวสารตลาดสหรัฐประจำวันที่ 23 มิถุนายน นักลงทุนยังคงระมัดระวังท่ามกลางความตึงเครียดที่เพิ่มขึ้นในตะวันออกกลาง รอติดตามการตอบโต้จากอิหร่านที่อาจเกิดขึ้นได้ แม้การตอบสนองของตลาดยังค่อนข้างนิ่ง แต่การเพิ่มขึ้นของความขัดแย้งอาจทำให้ราคาน้ำมันพุ่งสูงและเพิ่มความผันผวนของหุ้น ผู้เข้าตลาดจับตาดูถ้อยแถลงทางการเมืองและการพัฒนาการทหารอย่างใกล้ชิด เนื่องจากการปะทุรอบใหม่อาจส่งผลต่อแนวโน้มการเติบโตของเศรษฐกิจโลก ติดตามรายละเอียดเพิ่มเติมได้ที่ลิงก์นี้ ดัชนีหุ้นสหรัฐปิดตลาดในวันศุกร์ด้วยการแสดงผสม: S&P 500 และ NASDAQ ปรับตัวลดลง ในขณะที่
  • Grand Choice
    Contest by
    InstaForex
    InstaForex always strives to help you
    fulfill your biggest dreams.
    เข้าร่วมการแข่งขัน


บทความแนะนำ

การพยากรณ์อัตราแลกเปลี่ยนเงินตรา 23/06/2025: EUR/USD, GBP/USD, USDX, น้ำมัน, Ethereum และ Bitcoin

ลิงก์ที่เป็นประโยชน์: บทความอื่นๆ ของฉันสามารถอ่านได้ในส่วนนี้ หลักสูตร InstaForex สำหรับมือใหม่ ข้อมูลวิเคราะห์ยอดนิยม เปิดบัญชีซื้อขาย สำคัญ: ผู้เริ่มต้นในตลาดฟอร์เร็กซ์ควรระมัดระวังเป็นพิเศษเมื่อทำการตัดสินใจเกี่ยวกับการเข้าสู่ตลาด ก่อนการเผยแพร่รายงานที่สำคัญ ควรหลีกเลี่ยงการเข้าตลาดเพื่อป้องกันไม่ให้ถูกผลกระทบจากความผันผวนที่เพิ่มขึ้น หากตัดสินใจที่จะเทรดในช่วงการเผยแพร่ข่าว ควรวางคำสั่งหยุดขาดทุน (stop

Sebastian Seliga 12:08 2025-06-23 UTC+2

การวิเคราะห์ทางเทคนิคสำหรับสัปดาห์ที่ 23–28 มิถุนายน: คู่สกุลเงิน GBP/USD

ในสัปดาห์นี้ จากระดับราคา 1.3446 (ราคาปิดของแท่งเทียนรายสัปดาห์ที่ผ่านมา) ราคามีแนวโน้มที่จะลดลงต่อเนื่องสู่เป้าหมายที่ 1.3256 ซึ่งเป็นระดับการดึงกลับที่ 23.6% (เส้นประสีแดง) เมื่อทดสอบระดับนี้แล้ว ราคามีโอกาสเคลื่อนไหวขึ้นสู่ 13 EMA ที่ระดับ 1.3317

Stefan Doll 11:38 2025-06-23 UTC+2

การวิเคราะห์ทางเทคนิคสำหรับสัปดาห์ที่ 23–28 มิถุนายน: คู่สกุลเงิน EUR/USD

สัปดาห์นี้ จากระดับ 1.1520 (ปิดของเทียนรายสัปดาห์ล่าสุด) ตลาดอาจเริ่มเคลื่อนไหวลงไปสู่เป้าหมายที่ 1.1418 ซึ่งเป็นระดับหยุดพัก 14.6% (เส้นประสีน้ำเงิน) เมื่อลองทดสอบระดับนี้แล้ว ราคามีแนวโน้มที่จะดีดตัวขึ้นไปสู่ระดับหยุดพัก 76.4% ที่ 1.1452 (เส้นประสีแดง)

Stefan Doll 11:31 2025-06-23 UTC+2

การคาดการณ์สำหรับ EUR/USD ในวันที่ 23 มิถุนายน 2025

ในวันศุกร์ คู่เงิน EUR/USD ยังคงปรับตัวขึ้นหลังจากดีดตัวจากระดับการแก้ไข 76.4% ที่ 1.1454 อย่างไรก็ตาม ในคืนวันจันทร์ คู่เงินกลับมาที่ระดับนี้อีกครั้ง การดีดตัวใหม่ช่วยให้นักวิเคราะห์คาดหวังการเติบโตใหม่ของเงินยูโรไปยังระดับการแก้ไข 100.0% ที่ 1.1574 การที่อัตราของคู่เงินหากสามารถยืนอยู่ต่ำกว่า

Samir Klishi 11:24 2025-06-23 UTC+2

พยากรณ์สำหรับ GBP/USD ในวันที่ 23 มิถุนายน 2025

ในกราฟรายชั่วโมง คู่เงิน GBP/USD ในวันศุกร์ได้มีการรวมตัวต่ำกว่าพื้นที่สนับสนุนที่ 1.3425–1.3444 อีกครั้ง ซึ่งทำให้สามารถคาดหวังถึงการลดลงอย่างต่อเนื่องไปยังระดับสนับสนุนที่ 1.3357–1.3373 การดีดตัวจากโซนนี้หรือปิดเหนือระดับ 1.3425–1.3444 จะเป็นประโยชน์ต่อเงินปอนด์อังกฤษและการกลับมาเติบโตสู่ระดับ 127.2% Fibonacci ที่ 1.3527

Samir Klishi 11:19 2025-06-23 UTC+2

การวิเคราะห์ทางเทคนิคของการเคลื่อนไหวรายวันของคู่สกุลเงินแปลกใหม่ USD/IDR, วันจันทร์ที่ 23 มิถุนายน 2025

16473.27 ขณะนี้ในกราฟรายวัน คู่สกุลเงินหายาก USD/IDR มีรูปแบบ Bullish 123 ซึ่งบ่งชี้ว่า USD/IDR กำลังแข็งค่าขึ้น ซึ่งได้รับการยืนยันจากการเคลื่อนไหวของราคาของคู่สกุลเงินหายากนี้เหนือ WMA (21) ซึ่งยังลาดขึ้น ดังนั้นตราบใดที่ยังไม่มีการอ่อนค่าลงอีกที่จะทะลุและปิดต่ำกว่าระดับ

Arief Makmur 07:29 2025-06-23 UTC+2

การวิเคราะห์ทางเทคนิคของการเคลื่อนไหวของราคาน้ำมันดิบรายวัน จันทร์ที่ 23 มิถุนายน 2025

นอกเหนือจากการปรากฏขึ้นของ Divergence ระหว่างการเคลื่อนที่ของราคาน้ำมันดิบและอินดิเคเตอร์ Stochastic Oscillator บนกราฟ 4 ชั่วโมงแล้ว ยังมีรูปแบบ Bearish 123 และกราฟ Triangle ที่แสดงให้เห็นว่าในอนาคตอันใกล้นี้ #CL

Arief Makmur 07:29 2025-06-23 UTC+2

การคาดการณ์ EUR/USD สำหรับวันที่ 23 มิถุนายน 2025

เกิดสัญญาณความเบี่ยงเบนขาลงในกราฟรายสัปดาห์ของยูโร เรากำลังเตรียมพร้อมสำหรับการกลับตัวเข้าสู่แนวโน้มขาลงระยะยาว แต่การเบี่ยงเบนพร้อมกับช่องว่างมักจะขยายตัวในลักษณะที่ซับซ้อน ดังนั้น ราคายังอาจขยับไปตามเป้าหมายที่ระดับ 1.1692 โดยที่ความเบี่ยงเบนอาจมีการปรับรูปแบบใหม่ขึ้น เหตุการณ์ที่คล้ายกันเคยเกิดขึ้นในช่วงเดือนพฤศจิกายนถึงธันวาคม ปี 2020 นอกจากนี้ เรากำลังจับตาดูตลาดหุ้นอย่างใกล้ชิด เพราะเราเชื่อว่าการกลับตัวที่คาดว่าจะเกิดขึ้นจะสอดคล้องกับการปรับฐานของตลาด ในกราฟรายวัน วันจันทร์เปิดต่ำกว่าเส้น

Laurie Bailey 05:00 2025-06-23 UTC+2

การคาดการณ์ GBP/USD สำหรับวันที่ 23 มิถุนายน 2025

เงินปอนด์อังกฤษเริ่มต้นสัปดาห์ใหม่ด้วยช่องว่างขาลง แต่ยังคงมีความหวังในด้านดีอยู่ โอกาสที่ราคาจะกลับขึ้นไปเหนือระดับแนวต้านที่ 1.3433 ยังคงมีอยู่ ซึ่งจะส่งผลให้เป้าหมายเดิมที่ 1.3635 ยังมีความเป็นไปได้ อย่างไรก็ตาม ตัวบ่งชี้ Marlin ยังคงอยู่ในแดนลบ ทำให้การกลับตัวอย่างรวดเร็วเป็นไปได้ยาก ในแผนภูมิ

Laurie Bailey 04:56 2025-06-23 UTC+2

การคาดการณ์ราคาน้ำมันสำหรับวันที่ 23 มิถุนายน 2025

ในกราฟประจำสัปดาห์ เส้นสัญญาณของออสซิลเลเตอร์ Marlin ได้เริ่มกลับทิศทางจากระดับ 9.3600 ซึ่งในอดีตระดับนี้เป็นจุดที่เคยเกิดการกลับตัวลงครั้งสำคัญ เช่นในเดือนเมษายน 2023, ตุลาคม 2021, และเมษายน 2019 การเบรคออกที่ระดับนี้มีความหลากหลาย บางครั้งก็แข็งแกร่ง (เช่น

Laurie Bailey 04:56 2025-06-23 UTC+2
หากไม่สะดวกคุยในตอนนี้
ระบุคำถามไว้ได้ใน แชท.
Widget callback
 

Dear visitor,

Your IP address shows that you are currently located in the USA. If you are a resident of the United States, you are prohibited from using the services of InstaFintech Group including online trading, online transfers, deposit/withdrawal of funds, etc.

If you think you are seeing this message by mistake and your location is not the US, kindly proceed to the website. Otherwise, you must leave the website in order to comply with government restrictions.

Why does your IP address show your location as the USA?

  • - you are using a VPN provided by a hosting company based in the United States;
  • - your IP does not have proper WHOIS records;
  • - an error occurred in the WHOIS geolocation database.

Please confirm whether you are a US resident or not by clicking the relevant button below. If you choose the wrong option, being a US resident, you will not be able to open an account with InstaForex anyway.

We are sorry for any inconvenience caused by this message.