empty
02.10.2023 05:41 PM
EUR/USD. Analysis for October 2nd. European statistics disappoint again, and the euro falls once more

This image is no longer relevant

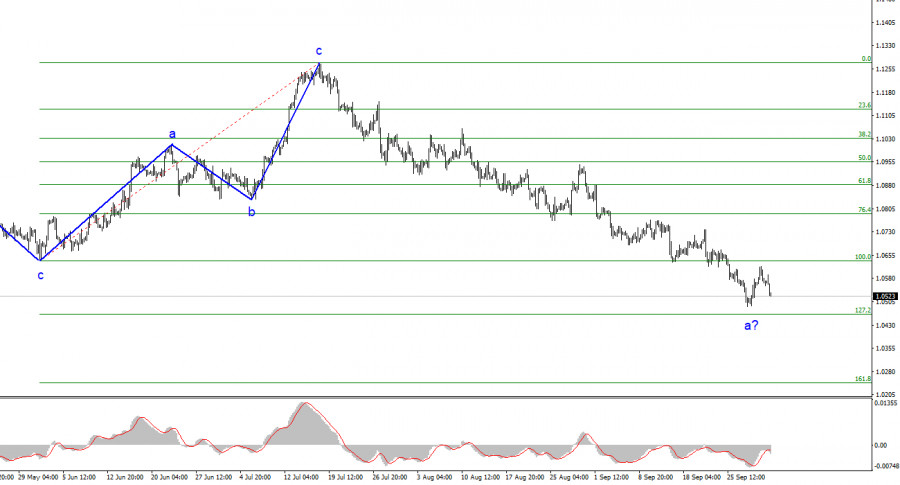
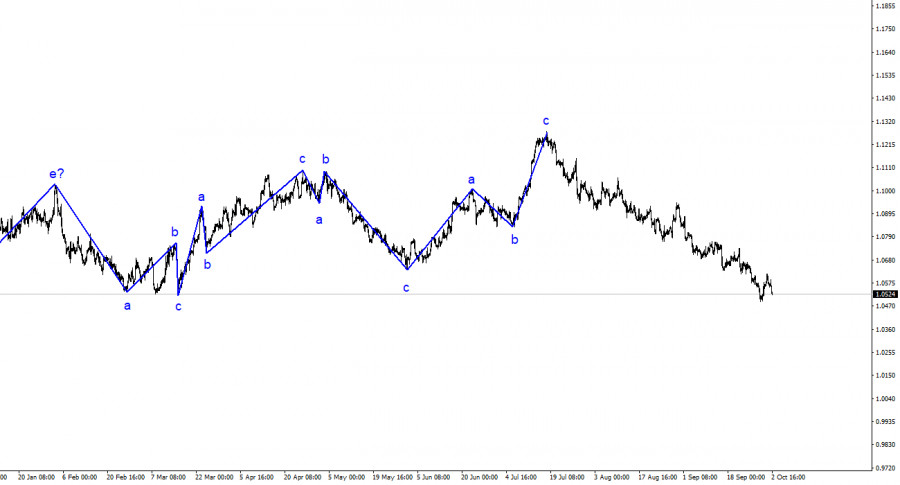
The wave analysis of the 4-hour chart for the euro/dollar pair remains quite clear. Over the past year, we have seen only three wave structures that alternate with each other consistently. Over the past few months, I have regularly mentioned that I expected the pair to be around the 5th figure, from where the construction of the last ascending three-wave structure began. This week, that target was reached. The assumed first wave of the new descending trend segment may continue its formation, although there are currently signs of its completion. These signs are mostly related to the possible completion of the first wave of the British pound.

None of the recent price increases resembled a full-fledged wave 2 or b. Therefore, all of these were internal corrective waves within wave 1 or a. If this is indeed the case, the decline in quotes may continue for some time during this wave. This means that the overall decline of the European currency will not be completed yet, as the construction of the third wave is still required. Within the first wave, five internal waves can already be traced, so its completion is approaching. A successful attempt to break above the level of 1.0637, which is equivalent to 100.0% according to Fibonacci, currently indicates the market's readiness to continue selling the pair with targets located around 1.0463.

The euro is uncertain about how to react to inflation.

The euro/dollar pair's exchange rate fell by 60 basis points on Monday. Demand for the euro continued to decline almost overnight. It started falling on Friday, to be precise. Honestly, I had questions about the pair's decline even on Friday. Today, these questions have neither increased nor decreased. The economic reports released on Monday in the European Union and Germany were, if one could put it this way, "predictably poor." The Business Activity Index in the manufacturing sector of Germany increased in September, but it increased from 39.1 points to 39.6 points. Obviously, such growth is challenging to attribute to the euro's positive factors. The same goes for the Business Activity Index in the manufacturing sector of the entire European Union. The indicator decreased from 43.5 points to 43.4 points. In other words, it remained practically unchanged. The unemployment rate remained unchanged at 6.4%, but the value of the previous month (July) was revised upward to 6.5%.

Based on all of the above, none of the reports had the potential to boost the euro. However, these reports should not have caused a significant decline in the European currency either. Therefore, I believe that the market maintains a "bearish" sentiment and has not yet completed the construction of the descending wave. This is why the demand for the EU currency continues to decline at such a pace. At this rate, the euro may fall much lower than the 5–6 figures I mentioned in recent months.

This image is no longer relevant

General Conclusions:

Based on the analysis conducted, I conclude that the construction of a downward wave set continues. The targets in the range of 1.0500–1.0600 have been ideally worked out, but the decline may continue for some time. Therefore, I continue to recommend selling the pair. Since the descending wave has not completed near the level of 1.0637, we can now expect a decline to the level of 1.0463, which is equivalent to 127.2% according to Fibonacci. However, the second corrective wave will start sooner or later on its own.

On a larger wave scale, the wave analysis of the ascending trend segment has taken on an extended form, but it is likely completed. We have seen five upward waves, which are most likely the structure of a-b-c-d-e. After that, the pair built four three-wave structures: two downward and two upward. Now, it has probably moved on to the stage of building another extended three-wave descending structure.

Chin Zhao,
ผู้เชี่ยวชาญด้านการวิเคราะห์ของ InstaForex
© 2007-2025
เลือกช่วงเวลา
5
นาที
15
นาที
30
นาที
1
ชั่วโมง
4
ชั่วโมง
1
วัน
1
สัปดาห์
รับผลกำไรจากการเปลี่ยนแปลงอัตราสกุลเงินดิจิทัลกับ InstaForex.
ดาวน์โหลด MetaTrader 4 และเปิดการซื้อขายครั้งแรกของคุณ.
DXY. ค่าเงินดอลลาร์มีความหวังในการฟื้นตัว วันนี้ ดัชนีดอลลาร์สหรัฐ (DXY) ซึ่งติดตามผลการดำเนินงานของเงินดอลลาร์เทียบกับกลุ่มสกุลเงินหลัก อยู่ในช่วงใหม่ของการเคลื่อนตัวขาขึ้นแบบสะสมหลังจากที่ได้แตะระดับสูงสุดในรอบเกือบหนึ่งเดือนใกล้ระดับ 100.75 ในช่วงการซื้อขายเอเชีย โดยดัชนีอยู่ในเส้นทางที่จะปรับตัวขึ้นเป็นสัปดาห์ที่สามติดต่อกันและดูเหมือนว่าพร้อมที่จะต่อเนื่องการฟื้นตัวหลังจากที่ได้แตะระดับต่ำสุดในรอบหลายปีในเดือนเมษายนที่ผ่านมา. ในสัปดาห์นี้, นายเจอโรม พาวเวลล์ ประธานธนาคารกลางสหรัฐ ได้เน้นย้ำถึงระดับสูงของความไม่แน่นอนเกี่ยวกับภาษีการค้าของสหรัฐ โดยเรียกร้องให้มีความอดทนจนกว่าจะมีความชัดเจนมากขึ้น ข้อสังเกตของเขาชี้ให้เห็นว่าธนาคารกลางไม่มุ่งหวังที่จะลดอัตราดอกเบี้ยในเร็วๆ
  • Grand Choice
    Contest by
    InstaForex
    InstaForex always strives to help you
    fulfill your biggest dreams.
    เข้าร่วมการแข่งขัน


บทความแนะนำ

การวิเคราะห์ GBP/USD วันที่ 8 พฤษภาคม 2025

โครงสร้างคลื่นของ GBP/USD ได้เปลี่ยนไปเป็นรูปแบบขาขึ้นที่มีแรงกระตุ้นจาก "ความสำเร็จ" ของ Donald Trump ลักษณะคลื่นใกล้เคียงกับ EUR/USD เป็นอย่างมาก จนถึงวันที่ 28 กุมภาพันธ์ เราได้สังเกตเห็นการก่อตัวของโครงสร้างการแก้ไขที่ชัดเจนและไม่มีปัญหาใด

Chin Zhao 19:40 2025-05-08 UTC+2

การวิเคราะห์ EUR/USD วันที่ 8 พฤษภาคม 2025

รูปแบบคลื่นบนกราฟ 4 ชั่วโมงของ EUR/USD ได้เปลี่ยนแปลงมาเป็นโครงสร้างขาขึ้น ผมเชื่อว่าไม่มีข้อสงสัยว่านี่เป็นผลมาจากนโยบายการค้าใหม่ของสหรัฐฯ ก่อนวันที่ 28 กุมภาพันธ์ เมื่อค่าเงินดอลลาร์สหรัฐเริ่มมีการลดค่าอย่างรุนแรง โครงสร้างคลื่นทั้งหมดดูเหมือนเป็นแนวโน้มขาลงที่ชัดเจน ส่วนที่เป็นคลื่นปรับฐาน 2 กำลังถูกสร้างขึ้น อย่างไรก็ตาม

Chin Zhao 19:33 2025-05-08 UTC+2

วิเคราะห์ GBP/USD ประจำวันที่ 7 พฤษภาคม 2025

รูปแบบแนวโน้มของ GBP/USD ได้ปรับเปลี่ยนเป็นโครงสร้างขาขึ้นในลักษณะกระตุ้น—"ต้องขอบคุณ" Donald Trump รูปแบบนี้คล้ายคลึงกับ EUR/USD จนถึงวันที่ 28 กุมภาพันธ์ เราเห็นโครงสร้างการแก้ไขที่ดูน่าเชื่อถือ ซึ่งไม่ได้สร้างความกังวล อย่างไรก็ตาม ความต้องการเงินดอลลาร์สหรัฐเริ่มลดลงอย่างรวดเร็ว ส่งผลให้เกิดโครงสร้างขาขึ้นแบบห้าคลื่นขึ้น

Chin Zhao 19:55 2025-05-07 UTC+2

การวิเคราะห์ EUR/USD วันที่ 7 พฤษภาคม 2025

รูปแบบคลื่นในกราฟ 4 ชั่วโมงของ EUR/USD ได้เปลี่ยนเป็นโครงสร้างขาขึ้น ผมเชื่อว่าแทบไม่มีข้อสงสัยเลยว่าการเปลี่ยนแปลงนี้เกิดขึ้นโดยสิ้นเชิงเนื่องจากนโยบายการค้าของสหรัฐฯ ที่เปลี่ยนไป จนถึงวันที่ 28 กุมภาพันธ์ ซึ่งเป็นช่วงที่ค่าเงินดอลลาร์สหรัฐเริ่มตกต่ำลงอย่างรุนแรง โครงสร้างคลื่นทั้งหมดดูเหมือนเป็นช่วงแนวโน้มขาลงที่น่าเชื่อถือ โดยมีคลื่นแก้ไขที่ 2 กำลังเกิดขึ้น

Chin Zhao 19:51 2025-05-07 UTC+2

การวิเคราะห์ GBP/USD – 6 พฤษภาคม: เงินปอนด์เมินเฉยต่อ BoE

โครงสร้างการเคลื่อนที่ของคู่เงิน GBP/USD ก็ได้เปลี่ยนมาเป็นโครงสร้างลักษณะขาขึ้นตามแบบ impulse ด้วยความ "ขอบคุณ" จาก Donald Trump ภาพคลื่นแทบจะเหมือนกับของ EUR/USD ก่อนวันที่ 28 กุมภาพันธ์ เราได้สังเกตเห็นโครงสร้างการแก้ไขที่น่าเชื่อถือซึ่งไม่ได้ก่อให้เกิดความกังวลใหญ่ใด

Chin Zhao 19:06 2025-05-06 UTC+2

การวิเคราะห์ EUR/USD – 6 พฤษภาคม: ธนาคารกลางสหรัฐยึดแนวทางเข้มงวด

วิเคราะห์กราฟ EUR/USD รูปแบบคลื่นบนกราฟ EUR/USD ช่วง 4 ชั่วโมง ได้เปลี่ยนเป็นโครงสร้างที่มีแนวโน้มขาขึ้น ผมเชื่อว่าไม่มีข้อสงสัยเลยว่าการเปลี่ยนแปลงนี้เกิดขึ้นเนื่องจากนโยบายการค้าใหม่ที่ใช้โดยสหรัฐอเมริกาเพียงอย่างเดียว จนถึงวันที่ 28 กุมภาพันธ์—เมื่อการลดลงอย่างมากของสกุลเงินดอลลาร์สหรัฐฯ เริ่มขึ้น—รูปแบบคลื่นได้นำเสนอแนวโน้มขาลงที่น่าเชื่อถือ สร้างคลื่นแก้ไข

Chin Zhao 19:03 2025-05-06 UTC+2

การวิเคราะห์ GBP/USD – 5 พฤษภาคม ธนาคารแห่งประเทศอังกฤษเตรียมอะไรไว้สำหรับเราบ้าง?

โครงสร้างคลื่นสำหรับคู่สกุลเงิน GBP/USD ได้เปลี่ยนไปเป็นรูปแบบเคลื่อนตัวขึ้นแบบแรง — "ขอบคุณ" โดนัลด์ ทรัมป์ ภาพของคลื่นนั้นเกือบจะเหมือนกับคู่ EUR/USD จนถึงวันที่ 28 กุมภาพันธ์ เราสังเกตเห็นการสร้างโครงสร้างการแก้ไขที่น่าเชื่อถือ ซึ่งไม่มีปัญหาใด

Chin Zhao 18:09 2025-05-05 UTC+2

วิเคราะห์ EUR/USD – วันที่ 5 พฤษภาคม: ภาษีใหม่ของทรัมป์ล้มเหลวในการสร้างความประทับใจ

โครงสร้างคลื่นในแผนภูมิ 4 ชั่วโมงสำหรับคู่สกุลเงิน EUR/USD ได้เปลี่ยนเป็นแนวโน้มแบบกระทิง ฉันเชื่อว่าไม่มีข้อสงสัยว่าการเปลี่ยนแปลงนี้เป็นไปได้อย่างสมบูรณ์เนื่องจากนโยบายการค้าใหม่ของสหรัฐอเมริกา จนกระทั่งถึงวันที่ 28 กุมภาพันธ์ เมื่อสกุลเงินดอลลาร์สหรัฐเริ่มต้นการลดลงอย่างรวดเร็ว โครงสร้างคลื่นทั้งหมดดูเหมือนจะเป็นแนวโน้มขาลงที่น่าเชื่อถือโดยสร้างคลื่นแก้ไขที่ 2 แต่การประกาศอัตราภาษีต่าง ๆ อย่างถี่ถ้วนของทรัมป์ทุกสัปดาห์ได้มีผลกระทบอย่างมาก

Chin Zhao 18:06 2025-05-05 UTC+2

พยากรณ์ประจำสัปดาห์ตามการวิเคราะห์คลื่นแบบง่ายสำหรับ GBP/USD, AUD/USD, USD/CHF, EUR/JPY, EUR/GBP และดัชนีดอลลาร์สหรัฐ – 5 พฤษภาคม

GBP/USD การวิเคราะห์: ในกราฟ 4 ชั่วโมงของเงินปอนด์อังกฤษ แสดงให้เห็นว่ากำลังมีการเคลื่อนไหวแบนแบบชั่วคราวในช่วงขึ้นที่เป็นส่วนหนึ่งของคลื่นขาขึ้นหลักที่สังเกตได้ในช่วงไม่กี่สัปดาห์ที่ผ่านมา ช่วงขึ้นที่ยังไม่เสร็จสิ้นนี้เริ่มตั้งแต่วันที่ 28 เมษายน แนวรับที่คำนวณไว้อยู่ตามขอบบนของบริเวณการกลับตัวที่เป็นไปได้กว้างบนกรอบเวลาแบบรายวัน การคาดการณ์: ในสัปดาห์หน้า คาดว่าราคาจะเคลื่อนไหวในลักษณะแนวนอน โดยมีแนวโน้มที่จะลดลงไปยังเขตแนวรับในอีกไม่กี่วันข้างหน้า ตามมาด้วยช่วงลอยตัวและความเป็นไปได้ในการกลับตัวเข้าสู่แนวโน้มขาขึ้น

Isabel Clark 10:43 2025-05-05 UTC+2

การพยากรณ์รายสัปดาห์ตามการวิเคราะห์คลื่นแบบย่อสำหรับ EUR/USD, USD/JPY, GBP/JPY, USD/CAD, NZD/USD และ ทองคำ – 5 พฤษภาคม

EUR/USD การวิเคราะห์: กราฟรายชั่วโมงของคู่สกุลเงินยูโรหลักแสดงให้เห็นถึงคลื่นขาขึ้นที่โดดเด่นตั้งแต่ต้นเดือนกุมภาพันธ์ การแก้ไขที่เกิดขึ้นในช่วงสามสัปดาห์ที่ผ่านมาใกล้จะเสร็จสมบูรณ์แล้ว ส่วนที่ยังไม่เสร็จตั้งแต่วันที่ 21 เมษายนมุ่งหน้าไปในทิศทางขาลง การคาดการณ์: ในสัปดาห์ที่จะถึงนี้ คาดว่าจะมีการเคลื่อนไหวของราคาด้านข้างเป็นหลัก ในอีกไม่กี่วันข้างหน้านี้ มีโอกาสสูงว่าราคาจะเพิ่มขึ้นไปยังโซนแนวรับที่คำนวณไว้ จากนั้นจะมีช่วงการเลื่อนตัวซึ่งมีความเป็นไปได้สูง และตามด้วยการกลับทิศและเริ่มต้นการเติบโตของราคา โดยคาดว่าความผันผวนสูงสุดจะเกิดขึ้นในช่วงปลายสัปดาห์

Isabel Clark 10:32 2025-05-05 UTC+2
หากไม่สะดวกคุยในตอนนี้
ระบุคำถามไว้ได้ใน แชท.
Widget callback
 

Dear visitor,

Your IP address shows that you are currently located in the USA. If you are a resident of the United States, you are prohibited from using the services of InstaFintech Group including online trading, online transfers, deposit/withdrawal of funds, etc.

If you think you are seeing this message by mistake and your location is not the US, kindly proceed to the website. Otherwise, you must leave the website in order to comply with government restrictions.

Why does your IP address show your location as the USA?

  • - you are using a VPN provided by a hosting company based in the United States;
  • - your IP does not have proper WHOIS records;
  • - an error occurred in the WHOIS geolocation database.

Please confirm whether you are a US resident or not by clicking the relevant button below. If you choose the wrong option, being a US resident, you will not be able to open an account with InstaForex anyway.

We are sorry for any inconvenience caused by this message.