Các mẫu thực tế
Các mẫu là các mô hình đồ họa được hình thành trong biểu đồ theo giá. Theo một trong những định đề phân tích kỹ thuật, lịch sử (chuyển động giá) thường tự lặp lại. Có nghĩa là biến động giá thường giống nhau trong các tình huống giống nhau, do đó có thể dự đoán chuyển động tiếp theo của tình huống với xác suất cao.
Actual Patterns
- All
- Double Top
- Flag
- Head and Shoulders
- Pennant
- Rectangle
- Triangle
- Triple top
- All
- #AAPL
- #AMZN
- #Bitcoin
- #EBAY
- #FB
- #GOOG
- #INTC
- #KO
- #MA
- #MCD
- #MSFT
- #NTDOY
- #PEP
- #TSLA
- #TWTR
- AUDCAD
- AUDCHF
- AUDJPY
- AUDUSD
- EURCAD
- EURCHF
- EURGBP
- EURJPY
- EURNZD
- EURRUB
- EURUSD
- GBPAUD
- GBPCHF
- GBPJPY
- GBPUSD
- GOLD
- NZDCAD
- NZDCHF
- NZDJPY
- NZDUSD
- SILVER
- USDCAD
- USDCHF
- USDJPY
- USDRUB
- All
- M5
- M15
- M30
- H1
- D1
- All
- Buy
- Sale
- All
- 1
- 2
- 3
- 4
- 5
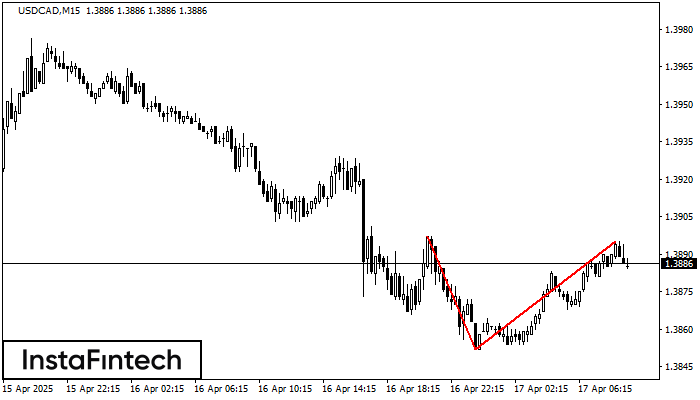
On the chart of USDCAD M15 the Double Top reversal pattern has been formed. Characteristics: the upper boundary 1.3895; the lower boundary 1.3852; the width of the pattern 43 points
The M5 and M15 time frames may have more false entry points.
Open chart in a new window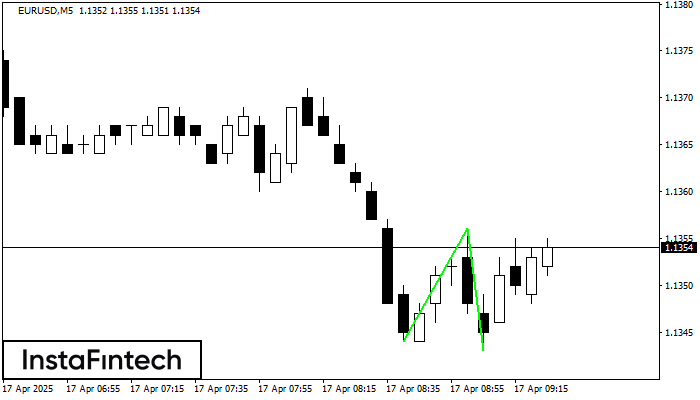
The Double Bottom pattern has been formed on EURUSD M5. Characteristics: the support level 1.1344; the resistance level 1.1356; the width of the pattern 12 points. If the resistance level
The M5 and M15 time frames may have more false entry points.
Open chart in a new window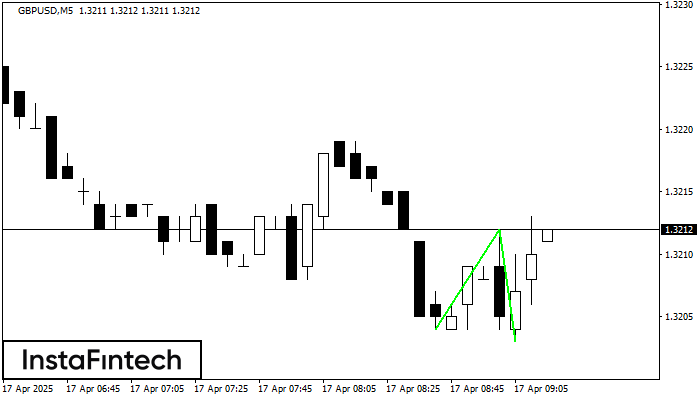
The Double Bottom pattern has been formed on GBPUSD M5; the upper boundary is 1.3212; the lower boundary is 1.3203. The width of the pattern is 8 points. In case
The M5 and M15 time frames may have more false entry points.
Open chart in a new window
On the chart of EURJPY M30 the Double Top reversal pattern has been formed. Characteristics: the upper boundary 162.23; the lower boundary 161.48; the width of the pattern 75 points
Open chart in a new window
The Double Bottom pattern has been formed on AUDUSD M5. Characteristics: the support level 0.6353; the resistance level 0.6366; the width of the pattern 13 points. If the resistance level
The M5 and M15 time frames may have more false entry points.
Open chart in a new window
According to the chart of M5, AUDUSD formed the Bearish Rectangle which is a pattern of a trend continuation. The pattern is contained within the following borders: lower border 0.6353
The M5 and M15 time frames may have more false entry points.
Open chart in a new window
According to the chart of M30, EURGBP formed the Bullish Rectangle. This type of a pattern indicates a trend continuation. It consists of two levels: resistance 0.8615 and support 0.8598
Open chart in a new window
The Double Bottom pattern has been formed on EURCAD M15. Characteristics: the support level 1.5761; the resistance level 1.5828; the width of the pattern 67 points. If the resistance level
The M5 and M15 time frames may have more false entry points.
Open chart in a new window
According to the chart of M5, NZDCHF formed the Bullish Rectangle. This type of a pattern indicates a trend continuation. It consists of two levels: resistance 0.4833 and support 0.4824
The M5 and M15 time frames may have more false entry points.
Open chart in a new window